Evaluating Risk-Adjusted Performance

Returns worth the risk?

Evaluate performance by comparing returns to risk taken.

Introduction

Risk-adjusted performance evaluates how well an investment compensates for the risks involved. 

It compares returns to risk, determining if higher returns justify added volatility. 

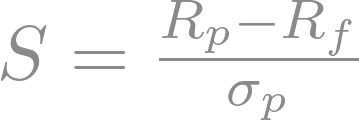
Metrics like the Sharpe Ratio (returns vs. volatility), Treynor Ratio (returns vs. market risk), and Jensen’s Alpha (excess returns vs. market) provide insights into a portfolio’s balance of risk and reward, helping investors make informed decisions about their strategy.

The Sharpe Ratio

The Sharpe Ratio assesses risk-adjusted performance by comparing an investment's excess return to its volatility. 

It is calculated by subtracting the risk-free rate from the investment’s return and dividing the result by the standard deviation of returns. 

A higher Sharpe Ratio indicates more efficient risk management, reflecting greater returns per unit of risk, while a lower ratio suggests less favorable outcomes relative to the level of risk assumed.

Breaking Down the Sharpe Ratio   

Sharpe Ratio.png

  • S | Sharpe Ratio – Indicates how much excess return a portfolio earns per unit of risk; higher values signal better risk-adjusted performance. 
  • Rp – The average return generated by the portfolio over the evaluation period. 
  • Rf – Return on a virtually risk-free investment (e.g., short-term Treasury bill); baseline that excess return is measured against. 
  • σp – Measures the dispersion of portfolio returns around their mean; a proxy for total risk faced by the investor.

Jane and the Mystery of the Sharpe Ratio

Jane’s commitment to reducing volatility gained traction when she analyzed her portfolio’s Sharpe Ratio. 

TechSpark’s erratic performance weighed heavily on the metric, pushing her to reallocate $2,000 into RiverBank Financial, a steadier asset with consistent dividends. 

The adjustment improved her Sharpe Ratio, highlighting the importance of risk-adjusted returns in refining her strategy. 

The interconnected moves made her portfolio more stable and consistently rewarding over time.

Jensen’s Alpha

Jensen’s Alpha evaluates a portfolio’s performance by measuring the excess return it generates beyond what is expected based on its beta and the market’s overall performance. 

This metric reveals whether active management has successfully added value. 

A positive alpha indicates the portfolio has outperformed its risk-adjusted expectations, demonstrating effective management, while a negative alpha suggests underperformance, highlighting insufficient returns relative to the risk taken.

Do you want to learn more?
Download InvestMentor to access the full lesson and explore interactive courses that build your financial knowledge and guide you toward smarter investing decisions.