Technical Indicators

Charts that indicate stock moves.

Interpret RSI, MACD, and more to spot trading signals.

14-13.png

Introduction to Technical Indicators

Technical indicators help traders read price data and spot market momentum. 

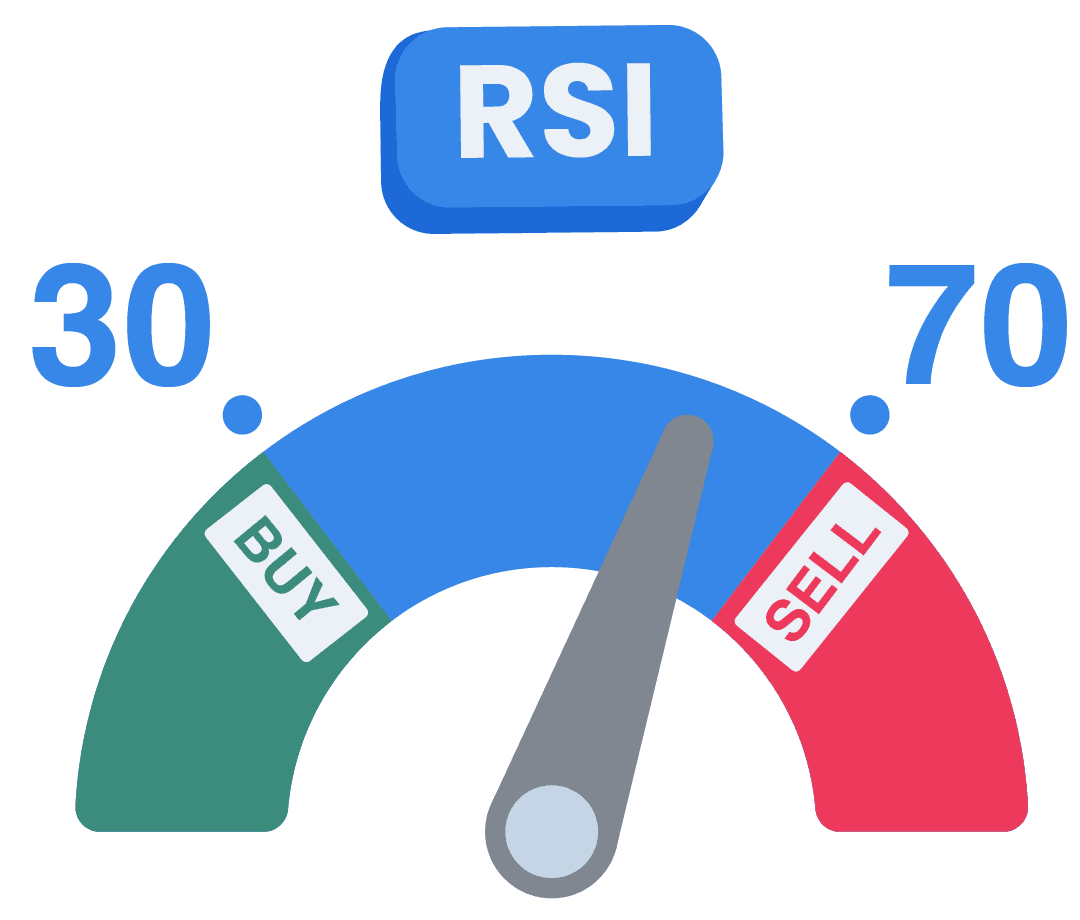
Some key indicators include the Relative Strength Index (RSI), which measures whether a stock is overbought or oversold. 

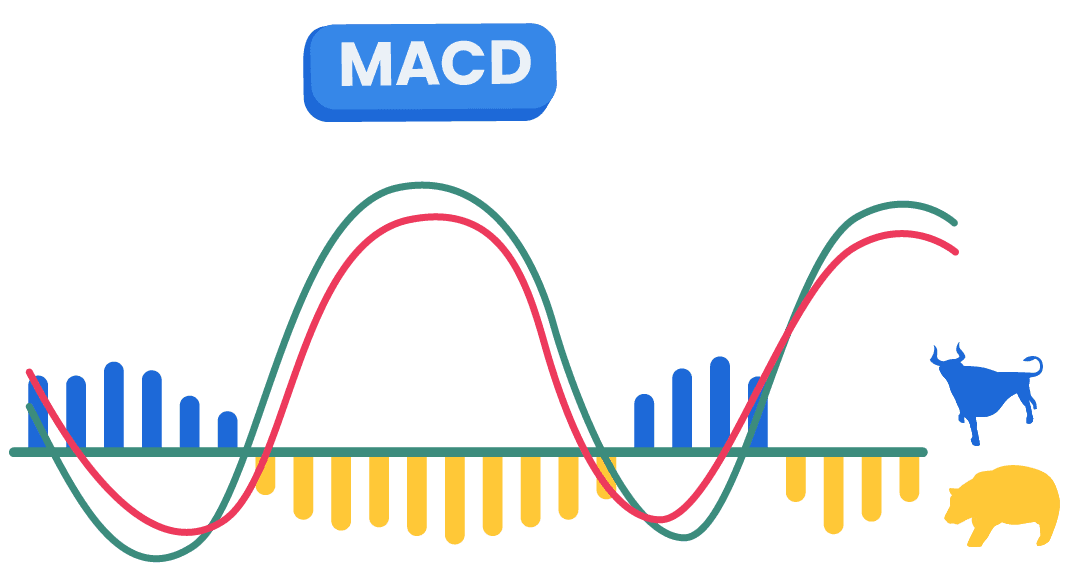
The Moving Average Convergence Divergence (MACD) tracks the difference between two exponential moving averages, signaling trend reversals. 

Bollinger Bands, another popular tool, measure price volatility. These indicators provide insights into market conditions, helping investors to refine their trades.

14-14.png

Measuring Momentum

The Relative Strength Index (RSI) helps traders assess a stock’s momentum

It ranges from 0 to 100, with readings above 70 indicating that a stock may be overbought (and potentially overvalued), while readings below 30 suggest it may be oversold (and potentially undervalued). 

Traders use RSI to spot reversal opportunities: when a stock’s RSI hits 70 or higher, it might be time to sell, and when it drops below 30, it might be time to buy.

RSI doesn’t necessarily predict direction — it highlights extremes.

14-15.png

MACD: Tracking Trends and Momentum

The moving average convergence divergence (MACD) is a momentum indicator that tracks trend strength and direction. 

It compares two exponential moving averages (EMAs) — typically the 12-day EMA and 26-day EMA — and plots a signal line (usually a 9-day EMA) to highlight shifts. 

When MACD crosses above the signal line, it may suggest a bullish move; below it, a bearish turn. Daniel uses MACD to spot trend reversals early and confirm signals from other tools like RSI.

14-16.png

Trading Volume as a Confirmation Tool

Trading volume shows how many shares are exchanged during a given time — and it’s critical in technical analysis to confirm price moves.

  • A price rise on low volume may signal weak interest
  • A rise on high volume suggests strong momentum

Volume plays a critical role in technical analysis by confirming the strength of price movements. 

Indicators like on-balance volume (OBV) track buying and selling pressure over time. Traders often wait for a volume spike to confirm breakouts or reversals.

14-17.png

Daniel Becomes Confident with Volume Analysis

While tracking GlobalTech, a stock that has long struggled to break through its $200 resistance, Daniel notices that a breakout above $200 — backed by a significant spike in trading volume. 

This surge confirms the strength of the move, so Daniel enters the trade at $205

Within a week, GlobalTech surges to $230. This experience reinforces the importance of volume as a confirmation tool, boosting Daniel’s confidence in his technical analysis strategy.

Do you want to learn more?
Download InvestMentor to access the full lesson and explore interactive courses that build your financial knowledge and guide you toward smarter investing decisions.